I am pretty sure that the high US employment figures can be explained away by the number of people employed to comment on future Fed action. I feel like a philistine in expressing the view that I find it all a bit dull. It can be compared to watching a Shakespearean play where the cognoscenti exhibit their literary prowess by laughing just before the clever witticism occurs, instead I’ll just laugh after the event when I've had time for it to sink in and understand it.
China - Down, down, deeper on down
In basic terms this is why the world is terrified.

The site also states that "...the country has consumed more concrete in the last three years than the United States did in all of the 20th century". A fact I haven't checked but find jaw dropping.
'Nuff said on China. If you want clever insight read George Magnus - you can find him on Twitter @georgemagnus1
It would appear that the markets are now bracing for global recession with the BAML survey creating stories such as this 'Fund managers braced for global recession' http://on.ft.com/1NuGgxr
Which has me assuming that 'braced' means 'positioned'.
Sentiment measures on SPX are also flashing 'it's in the price' (H/T @NicTrades)

But a couple of things have happened this week that make me go 'uhhhm'. The first is related to the anatomy of a crash. When things get nasty everything starts to correlate in a nasty way with regards to down moves. Pretty obvious really as the perceived cause of global disaster is watched by 'Macro Tourists' as the trigger for moves in all other markets. Though correlations are still high relative to long term averages , they are starting to fall.
 |
When I went away every move in Chinese stocks was being shadowed by Developed Market stocks (in particular commodity stocks), yet over the last couple of days this relationship appears to be waning. China had a hefty dump on Monday yet DM markets appear to be shrugging it off. Indeed the techie sector is now even threatening to break upwards through some interesting levels, all the more interesting if you look at the Nasdaq super-low sentiment level in the table above.

Can I read this as a sign of short term punter ADHD? I could try and rationalise it by suggesting that if you were going to get short on the China story you would have done so by now, having had a few weeks to sell rallies and, of course. believing that this is 'the big one' you wouldn't be waiting for a massive rally to sell into.
The volatility market is still making headlines with remarks being made as to the shape of the VIX curve and the VVIX vol of vol. There comes a point where trading the derivatives of derivatives starts to cause ripples in the deep space of price complexity that becomes detached from the actual here and now of the basic price. Much as using the Hubble telescope to study oscillations in binary star systems billions of light years away may give an insight into the weather next Monday and therefore to umbrella sales but it is more likely that umbrella prices will be more dependent on how cheaply China can make them.
But the most important thing to remember and mistake not to make, is to recognise that implied volatility is not actual volatility. The VIX et al are measures of perceived future volatility derived from the prices people are willing to pay for options. Actual volatility can be very different. I have a feeling that though implieds are running hot at the moment they are about to be undermined by a fall in actual volatility. A further point is that historic volatility, which is what actual volatility was (not is), is not present actual volatility.
Currently implied vols in major equity indices are trading lower than historics in the 3 months. (thanks to @BrokenBanker for the Bloomberg screenshots)
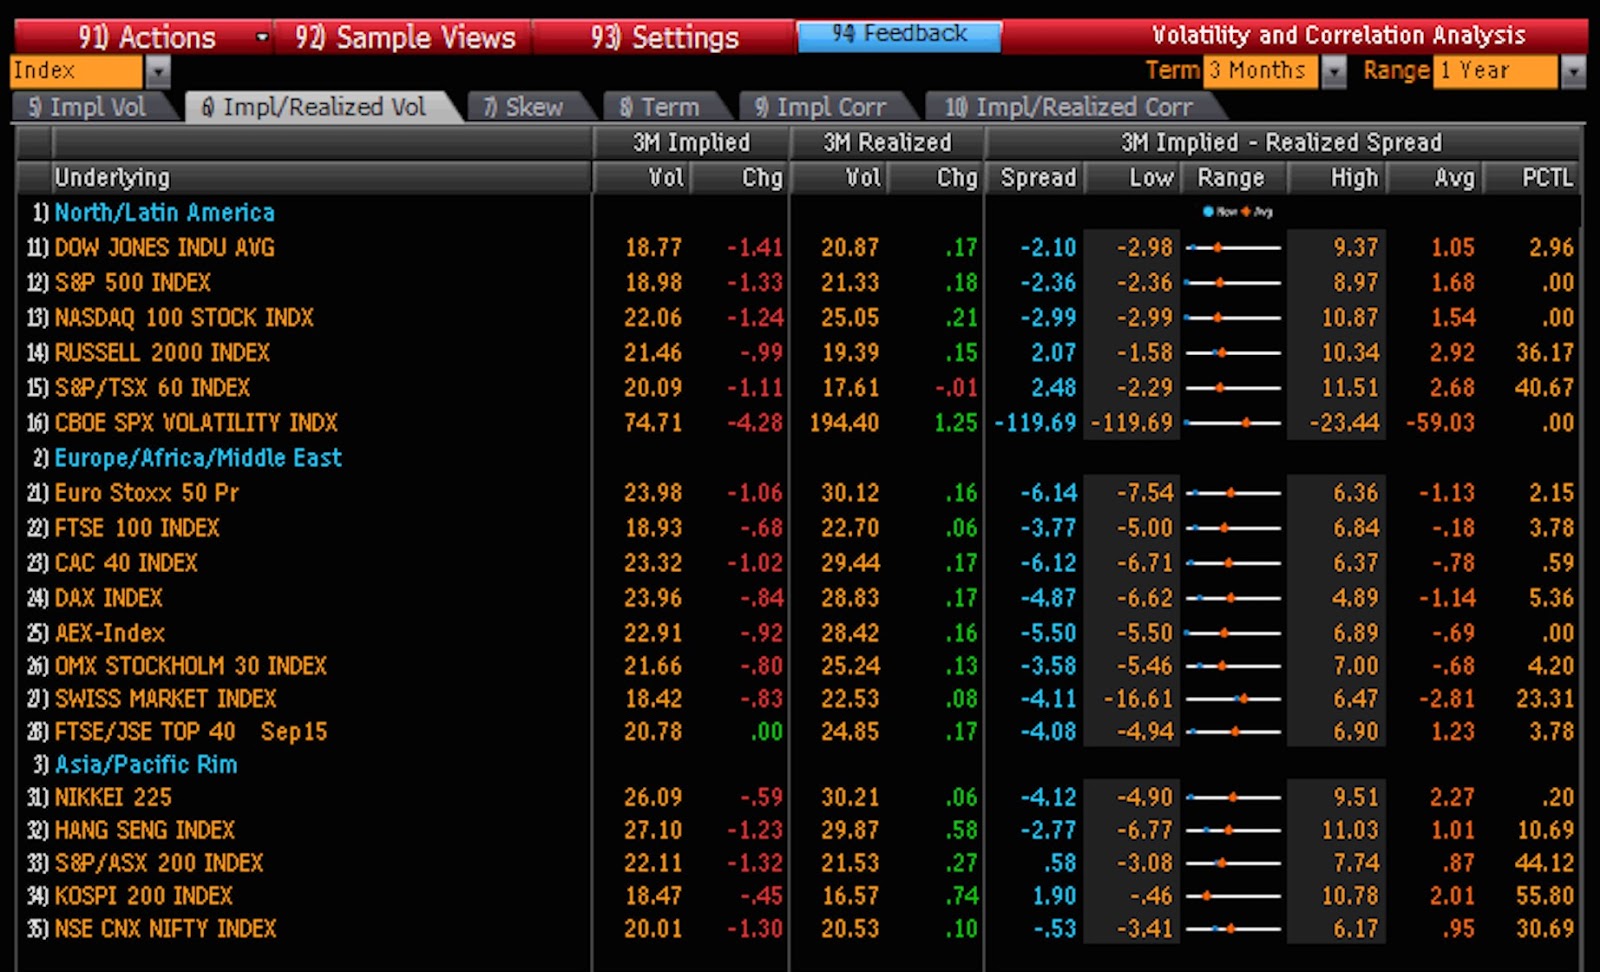
But this doesn't mean that the implieds are too low. It just means that people don't think we will have a blow up similar to August's any time soon. Historic volatility, by it's nature, lags. It's effectively an historic moving average. If it is announced that a currency is to be pegged in a week's time the historic would not reflect the fact that volatility will be 0 until the historic period expired, whilst the implied would probably fall, but not to zero as players would be betting on the chance the peg didn't happen or would blowup, whereas the actual volatility would be 0.
My general point is that using volatility as an indicator is a minefield unless you know exactly what you are looking at. Implied volatility is partly volatility but mostly a huge chunk of estimated probability. Just look at volatility pricing in the USD/Saudi Real which has a volatility of near zero. As with CDS, volatility is crude tool for financial journalists to twist stories of woe from.
We all like to yell and scream at high intraday volatility but the best way to defuse the panic is to apply moving averages. Below is the SPX with 2(green) 5( grey) and 10(red) day moving averages applied.

I know I should be using fibonacci numbers as they are apparently magical but looking at the nice normal 10 day (2 week) we can defuse the whole of September's moves back to 'remarkably dull'. I am predicting that falling actual volatility will undermine positions in implied volatility and with it a reverse pressure on the risk parity funds that have been so cited for vol following trades, to actually start buying back.
I am still not playing the 'it's all going to melt by the end of the week' theme even with the Fed in play.
Oil - There has been a renewed call fro analysts that $20 oil is on the way again with Goldman joining the fray. The last time this happened we saw the base (Shakespear's oil bear witch project). We also have another signal. The tabloids are calling for £1/litre petrol in the UK yet the oil chart doesn't exactly say 'dump' to me.

The majority of assumptions are based on the continuation of trends and that is why so many are wrong.
One last thing - There is a very good WSJ series on Tom Hayes and his case the third instalment of 5 being here - http://graphics.wsj.com/libor-unraveling-tom-hayes/3. the march of the regulator continues and I continue to suggest that if the transparency on pricing demanded of financial institutions were applied to the rest of the retail sector then UK High Streets would, far from being rejuvenated, have to be refitted as jails.
*For financial regulatory news and updates on current cases I recommend following @NewLeafAdvisory on Twitter.

10 comments:
Much of futures in many markets implies a lot, which the underlying cash markets cannot support, nor do they necessarily indicate. With Volcker and Basel3 and DoddFrank, the cash settled markets are even more divorced from futures compared, say, to a decade ago. That's another kind of reason to doubt the volatility forecasts from futures. Capital and risk have become very expensive, relative to the past, due to new regulations (which are supposed to protect the collective). The Maginot Line was supposed to protect France, similarly the Wall of China, and the Germans predicted victory over Russia once they reached Moscow (and Napoleon burned Moscow and still lost). Plans eh? Be well ;-^)
Cheers Frank. Agree regulations are acting like a pair of hands trying to squeeze a balloon. Just means the balloon squeeze sout between the fingers. Risk just expresses itself through other means that they hadn't thought of or regulated against .. yet. Regulators are always one step behind financial innovation.
Polemic, love your site. With the volatility correlations, well there has not been true risk aversion to since this bull started, but the question is will there be ?? Once the bunnies line up, things do fall apart fast and furious, but that can only last for a short while. If this was to be the start of a bear market in S&P 500, one would expect to see:
1) Market that rolls over (tick - looks suspiciously like a broad top there over the last 12 months)
2) 10-15% correction from peak (tick)
3) recovery of 50% of the loss - or other magical fib number, anyway, enough to suck in remaining buy the dip bulls and burn off overly keen or early bears (could happen after FMOC tomorrow)
4) savage drop from 3) to 20-50% from peak.
Granted we could also see things ripping up from here into the stratosphere, but the odds I think would tend to favour this being the beginning of a bear because
1) earnings momentum rolling over (there is really not that much further profit as % GDP can increase and earnings growth expectations have not been met at all this year)
2) Asset prices are at quite spectacular levels (except resources) and due for a lickin. I saw a graph today that as proportion of GDP, stockmarket + real estate value is equal to the most they have been since 1800! Like a frog in boiling water, we get used to how overvalued things are, but the reason things are so overvalued is because of ZIRP ! It is hard to see anything that is undervalued resources, gold, bonds included. Even cash (USD) is probably overvalued. Maybe JPY is undervalued. This could be the first time ever everything has been synchronized overvalued. Nowhere to hide if you have to participate in the market.
A bear market takes a while to get rolling, but that is not the same as saying it can't or isn't happening. I see things equally balanced and perhaps either could happen at this point - 20% melt up or 30% melt-down.
Booger, thanks for the kind words and I'm enjoying your comments on the old alma mater Macro Man site too.
I agree that on GDP measures things look hot but investment valuations are about cash flows rather than picking GDP as a measure (why?). Perhaps we should be measuring not the mkt cap of stocks vs GDP but the total coupon/ dividends. That is the numerator on most yield equations rather than core price. As long as stocks yields beat other forms of return then prices can remain high. As you say, it's all down to ZIRP. If your alternative is zero return then a stock with any dividend at all can be priced to infinity and still out perform the zero alternative. If earnings are falling then dividends are assumed to fall and so prices have to to adjust to keep yields the same. But I wonder what the yields on the alternatives will be doing whilst that happens. Of course when a company goes bust it's bust and that is the edge we should be looking at in a falling growth market. We really haven't seen anyone important die yet, Ok M+A tends to scoop up duds for their assets and goodwill before they go properly bust but whilst we have low global yields stocks may continue to look overvalued on historic measures but continue to perform.
Would I rather be holding a divi paying corp that makes things we need or a UST? The stock please.
Back to your last point re everything being overvalued including cash. I can't see how that can be as any measure of price is a ratio of one thing against another and the price of stocks is vs cash. If there is a dump in stocks the value of cash relative to them has gone up.
I have full sympathy for your view that things may yet get walloped. I just don't know. Perhaps I'm running more on hope than sense!
Big thanks for your comments
Amazing graphic on China usage of Commodities; but isn't this why we don't need to worry. China is in the middle of it's growth stage, not at the end of it. The population is 3 to 4 times the size of the USA and a lot younger. Also actual physical contracts for commodities are often quite long with prices agreed and fixed at the start, so profits are not necessarily linked to the "spot" price. The profitability problem will start when once enough new contracts have been written at a lower price or if China is closer to end of it's growth cycle than we think.
Polemic, I was probably being hysterical saying everything was overvalued. Obviously I have deemed cash is the best option for me at the moment, but an uncomfortable one with ZIRP. I think with the valuation of stocks, the key is what is the discount rate a prudent investor would use.
If one uses current rates then valuations are only slightly overpriced, but you would have to have fairly significant recency bias. Rationally one should use a rate adjusted for the likelihood of rates reverting to the mean over the next 10 years (or however many years one thinks mean reversion will take) for a long duration asset like stocks. I mean we are at very extreme levels on low rates. They could go down further but chances are the average over the next 30 years will be higher on average than now. Anyway, using an adjusted rate, stocks are overpriced and other measures (Tobin's Q, CAPE) also indicate it is overpriced.
Jeremy Grantham argues that the S&P 500 would only reach bubble valuations at around 2350 (he defines this as 2 sigma standard deviation from long term trend line).
But what are the chances of the S&P 500 going from a massive bubble in 2000, crashing, going to a smaller bubble in 2007, crashing but still getting to a bubble stage in 2015 ? That is pretty bonkers isn't it? It would indicate an irrational element to the market, like perhaps people have no memory, collective alzheimers or pain has no effect on learning. If you had asked me in 2011, I would have said there is no way people would be insane enough to push valuations back to bubble territory immediately after the experience of 2009. That we actually got to near bubble valuations again is amazing, so I reckon banking on it getting to 2350 is risky. Perhaps it will happen or perhaps it is going back to the well one too many times...
Thorium238: China's working age population is predicted to peak in 2015 (this year!). Due to the residual effects of their one child policy, the demographics going forward are likely to be worse than the U.S's.
Thanks Booger
Thorium238 understand your Tone, but perhaps your arguments mean that commodity shock hasn't yet occurred. Owww when it does.
Booger,
sorry for nitpicking but iirc Grantham said that bubble territory starts at 2250, not at 2350. Which would mean that we were not that far away at 2128. But maybe it is just old age on my side.
Polemic - I guess where i was going with this was if the spot price for commodities remains low for an extended time; as contracts expire and get renegotiated the prices and potentially the profitability of those contract could be lower, but the overall effect will be rather like a long term moving average. So we could have some way to go yet.
Booger - you are right about the demographics; but if you consider the maturity of the 2 economies the outcome should be quite different.
Eddie, yes thanks for pointing that out. I must have added 100 points as a margin of safety ;)
Actually I had made a mental note earlier this year to start shorting from 2350 or when the clearly market breaks the uptrend.
Post a Comment